Thursday, July 20, 2006

Employment Drives Trust Fund Growth?


.

.

.

.

.

.

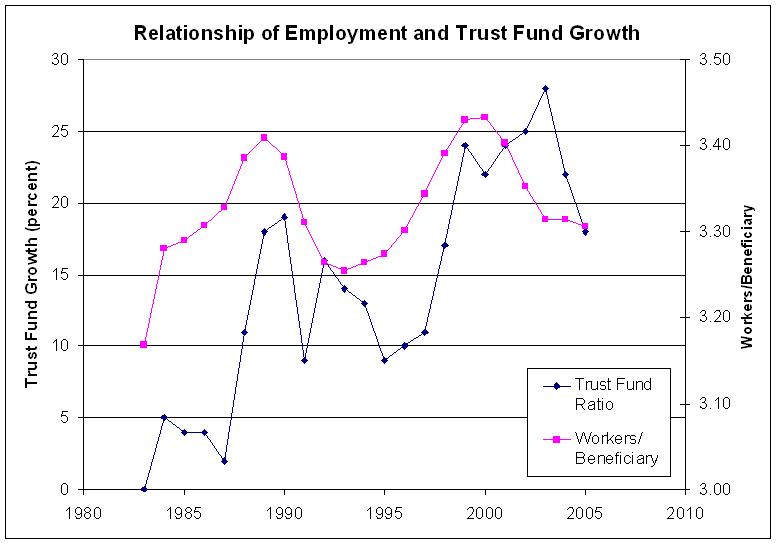
I posted a comment at Economist's View that I believe employment is more critical than productivity to growth of the SS Trust Fund. When employment (as observed in the ratio of workers per beneficiary) changes, the growth of the trust fund appears to follow.

Thursday, July 13, 2006

SSA Long Range Model - Life Expectancy


.

.

.

.

.

.

Even the LC seems over conservative to me. The numbers for females seem to be already in diminishing returns. The numbers for males are catching up to females. There is greater than 25 percent difference in how long people could expect to draw benefits, which seems like it would create a impact all by itself.

SSA Long Range Model - Productivity


.

.

.

.

.

.

Recent productivity numbers have been higher than the assumed values. When compared to the last 25 years perhaps not so bad. Then again, the trust fund growth beat out the estimates even during times when productivity was less than the 25 year average. How good is the SSA model?

Saturday, July 08, 2006

Solvency of Program with Trust Fund


.

.

.

.

.

.

The chart in the previous post does not represent reality because it ignores the interest that the Trust Fund is earning. With the interest included the lines for the Low Cost assumptions never cross - the combination of PAYGO and Trust Fund creates a fully solvent program.

In my opinion, while it seems likely that an adjustment will need to be made to account for changing demographics, I think the decision point is 10 to 15 years from now when we have a better idea of which curves we are following.

Solvency of a PAYGO Program


.

.

.

.

.

Here is a different way to look at Social Security solvency. When the solid line drops through the dotted line, the contributions are not enough to cover the costs. This correspondes to the date when we will need to start using the interest from the trust fund. The chart helps make it clear that a pay as you go (PAYGO) program [which would not have any interest to draw on] that works for one demographic is not balanced when the demographic is changed.

Thursday, July 06, 2006

Low Cost Assumptions for SS Trust Fund Solvency


Bruce Webb has been posting about why the shape of curve I does not change from year to year, even as the Trust Fund exhaustion date reported by the trustees (where curve II crosses zero) has been moving to the right almost every year. http://bruceweb.blogspot.com/2004/11/what-is-low-cost-alternative-what-does.html
It seems clear to me that curve I (per the 'Low Cost' assumptions) is not an estimation so much as a calculation of a condition under which the trust fund is not overfunded. As Bruce observes, this condition has required more and more pessimistic assumptions each year. If he is correct, we will never reach exhaustion.

Monday, July 03, 2006

Social Security Actuarial Modeling


Is productivity really the number one factor in modeling trust fund depletion, or does it look that way because we have not yet seen the uptick in population of retired baby-boomers?